On the server
From phase 02, the PowerGuard agent runs at the management layer of each server, sampling the power rails continuously and seeing the command layer directly.
 PowerGuardBAREKET AIRequest a pilot
 A compromised server can falsify every log it writes. It cannot falsify its own power draw. This page follows that signal end to end: the buses we read, the detectors that judge them, the hardware it is proven on, and exactly what leaves your environment. Written for the people who run the infrastructure.
The analysis tier is installed on your infrastructure, not inside your servers. And phase 01 installs nothing anywhere.
From phase 02, the PowerGuard agent runs at the management layer of each server, sampling the power rails continuously and seeing the command layer directly.
An appliance on your network aggregates fleet telemetry and runs the analysis. In phase 01 it is the only component involved, reading over the standard management API, installing nothing.
The fleet view runs in your cloud tenancy or entirely on premises. Air-gapped operation is a supported configuration, not a special case.
PowerGuard reads the power-control plane of the server: the BMC, the PMBus bus, the voltage regulators and the rails they drive. Collection runs in one of two modes, and the honest comparison between them matters.
| Capability | Management APInothing installed, phase 01 | On-server agentphases 02–03 |
|---|---|---|
| Inventory & topology | Full fleet | Full fleet |
| Firmware & configuration state | Read on every poll | Read continuously |
| Telemetry sampling | Periodic, seconds per poll | Continuous: 100 Hz per controller |
| Command-layer visibility | Not visible | Every power command observed |
| Baseline resolution | Coarse, drift and configuration | Fine, millisecond physical behaviour |
| Response | Report only | Block under your signed policy, phase 03 |
No single test decides anything. Independent detectors read the same telemetry, and enforcement acts only on physical or protocol evidence, never on a statistical anomaly alone.
Every reading is checked against the physical operating envelope learned for that exact unit, not a datasheet, your hardware.
Abrupt shifts in behaviour are flagged the moment the statistics of the signal change, before thresholds are ever crossed.
Commands and physical response are compared continuously. Effect without cause, or cause without effect, is evidence.
Each server's behaviour is measured against its own history and the fleet's, so slow drift stands out as clearly as a spike.
Independent readings of the same physical quantity are cross-checked, so a lying sensor cannot pass unnoticed.
There is no language model in the detection path. PowerGuard learns the physical behaviour of your own hardware and measures how far the present sits from it.
The baseline comes from your hardware under your workload, not from a generic profile.
The model does not absorb an attack in progress into its own definition of normal.
Deviation is measured, and every verdict carries the measurement behind it.
The model runs inside your environment; your telemetry does not train anything for anyone else.
A coordinated AI workload swing looks dramatic on a power chart. Structurally, it is nothing like protocol abuse, and the difference is measurable on four independent axes.
Legitimate load moves inside the physical envelope learned for that exact unit, ramps the hardware was designed for. Destructive commands push rails outside that envelope, which is precisely what the envelope detector exists to see.
Workload transitions follow scheduler ramps with characteristic rise profiles. Attacks produce discontinuities the physics of a healthy system does not produce on its own.
A training run moves hundreds of servers in step, the fleet view shows one coherent event. An attack rarely does; a single server departing from a fleet-wide pattern is signal, not noise.
Every legitimate physical change is preceded by a command chain that explains it. Physical effect with no explaining command, or a command with no matching effect, is evidence, and that is the desynchronisation detector's whole job.
A legitimate load spike is examined, never punished: response requires physical or protocol evidence, and the record-only phase exists so you can watch every decision the system would have made on your own workload, including your training runs, before enforcement is ever enabled.
The baseline that judges every reading against the physics of a healthy unit does not care why a unit departs from it. Slow drift means ageing hardware. A millisecond discontinuity means something else entirely. Both come out of the same measurement.
Every controller carries a health score derived from its own baseline. When a component starts to drift, you get 24–72 hours of warning, and a ticket in your queue before the outage, not a post-mortem after it.
Early-warning capability is being validated with design partners on production hardware.
The same engine reads a departure measured in milliseconds as what it is: a command doing something the physics of a healthy system never does on its own, detected at 20 ms in lab validation, before silicon damage.
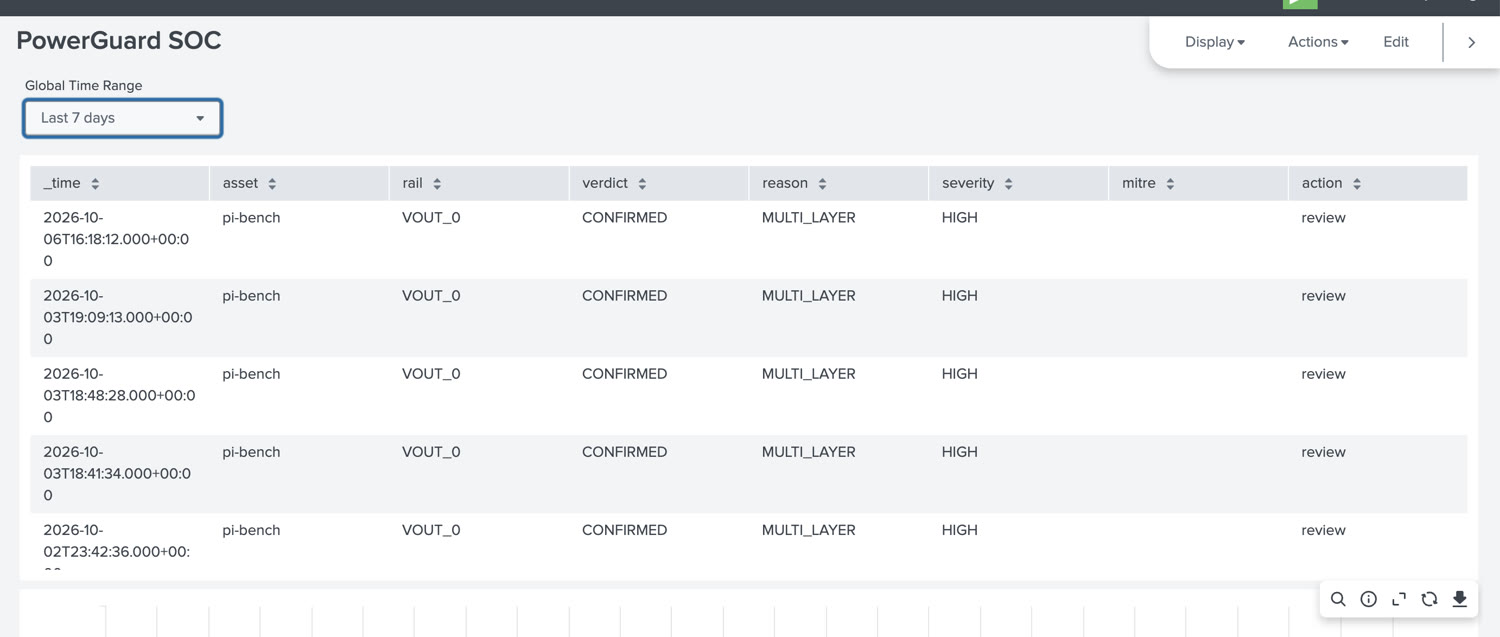
A live attack drove a rail from 5.21 V to 4.64 V. PowerGuard identified the physical evidence and produced a verdict in 20 milliseconds.
The attack class is public research: PMFault (TCHES 2023) showed that PMBus overvoltage commands can permanently destroy server CPUs with no physical access. Our Gen 0 testbed reproduces the class of event, and detects it from the physics, at 100 Hz, before damage.
Understand every rail, controller and relationship. Then move from anomaly to decision with evidence your security and operations teams can trust.
PowerGuard metrics from real hardware, live in Datadog: rail voltage and current, anomaly score, alert status and thermal state. This is the actual security dashboard our Gen 0 unit reports to.
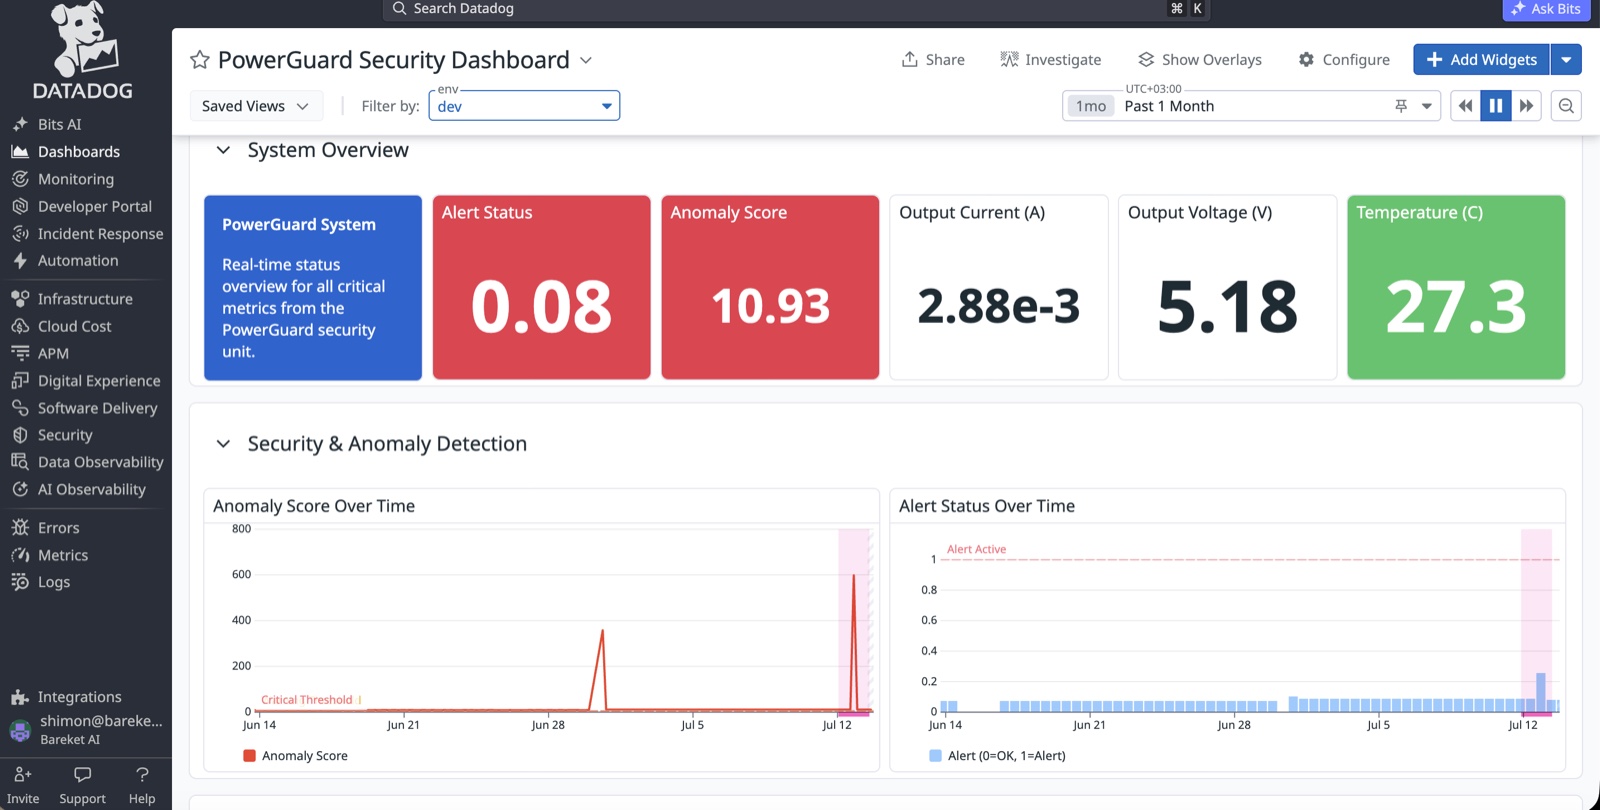
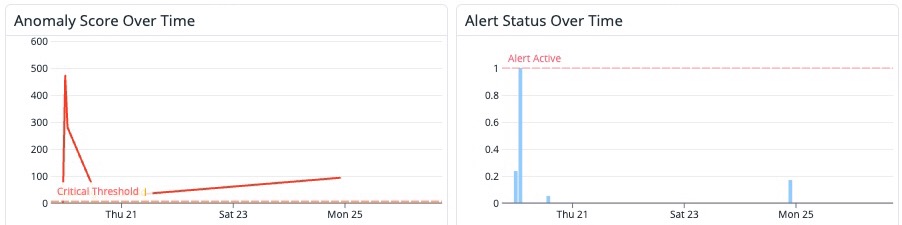
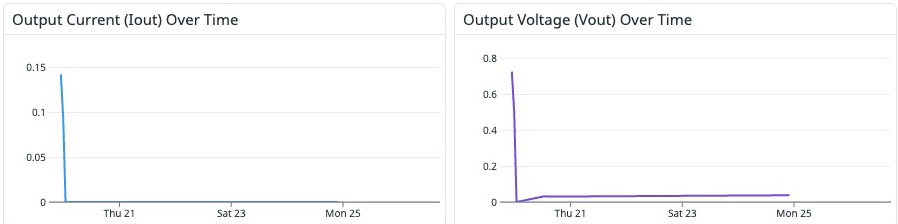
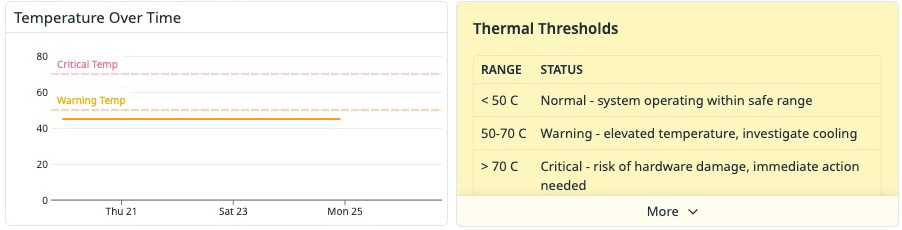
The console is the daily-use interface. The same findings publish into the security and operations stack you already run, you choose which surface each team lives in.
Findings and evidence delivered into Splunk and Microsoft Sentinel, in the format your correlation rules already expect.
Health and security metrics stream to Datadog, the live dashboard above is exactly this integration, running.
Predictive findings raise tickets in ServiceNow automatically, so degrading hardware enters the queue your team already works.
Continuous power telemetry at fleet scale is a volume no northbound platform should ingest raw. The pipeline is built so it never has to.
Up to 100 Hz per power controller in agent mode; periodic polls over the management API in phase 01. Raw samples never leave the tier that produced them.
The layered detectors run at the edge, on your infrastructure. Every sample is examined; almost none needs to travel.
Full-resolution history stays local, at a retention you set, available for forensics and baselining for as long as you want it, and no longer.
Verdicts, findings and evidence packs go northbound to the tools you already run, orders of magnitude smaller than the raw stream they summarise.
The exact reduction ratio depends on fleet size and sampling mode; it is measured on your own fleet during the pilot and written into the success criteria, a factual number, not a brochure claim.
The power layer is entering the regulations · PMBus 1.5 on the protocol side, NIS2 and IEC 62443 on the operator side. PowerGuard assesses your fleet against them continuously, not the week before the audit.
Configuration and command posture assessed against the protocol's own secure-device profile, unit by unit.
The same measurements mapped to the controls your regulators and customers audit against.
Findings exported as documents an auditor accepts, generated from your own fleet, on demand.
Run locally. Keep control. The home page states the position, this is where a security architect verifies it: what runs where, what leaves the environment, and who holds authority.
Your fleet is measured against a physical standard. PowerCert offers that same standard to the vendors who make the power components themselves, so the parts in your next servers arrive already validated against the detectors that will watch them in production.
Components are exercised against the same envelope, timing and command detectors that run in the field, certification and production measure the same physics.
The program covers the components that actually switch the power, silicon MOSFET and GaN alike, certified by the vendors who build them.
A certified part means its behaviour under attack conditions is known before it enters your fleet, not discovered there.